
An AEO expert’s guide to RAG

To drive a car you don’t really need to know what’s happening under the hood. However, a bit of “under-the-hood” knowledge won’t harm you and might just save the day if your vehicle breaks down on a lonely highway a hundred miles from the nearest service station or garage.
As an AEO expert, understanding how RAG works is similar under-the-hood knowledge, and it might just end up becoming your alpha.
RAG (Retrieval Augmented Generation)
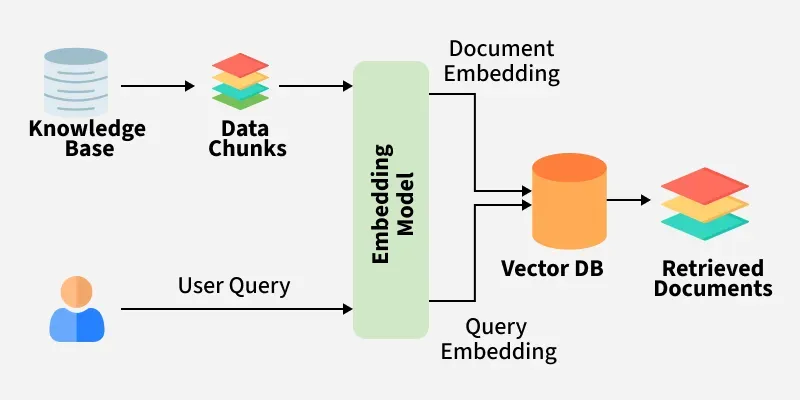
Retrieval Augmented Generation, or RAG, is the mechanism that lets large language models pull in outside information and use it to generate an answer, rather than relying only on what they learned during training. Why does it do that? There are quite a few reasons. The LLM’s memory might not have the latest information, or the question asked may not be there in the memory at all. Combining information from external sources with what’s there in memory has helped AI models become powerful assistants for humans.
As an AEO expert, your only window of opportunity to get into the AI answer is when the LLM is scouting for external information. You can imagine the AI engine searching an index of content, retrieving the passages most relevant to that query, and handing them to the model as context before it drafts a reply.
The external information is presented to the AI engine by the search APIs (it’s kind of an open secret that ChatGPT uses Bing, Claude uses Brave, and Gemini uses… you figure this one out). The search APIs, on the other hand, chunk web content and hand over a collection of chunks to the AI engine.
RAG begins with a basketful of content chunks waiting to be processed by the LLM.
To help you visualize better, I am sharing an example from the the Brave API documentation:
{
  "grounding": {
    "generic": [
      {
        "url": "https://example.com/page",
        "title": "Page Title",
        "snippets": [
          "Relevant text chunk extracted from the page...",
          "Another relevant passage from the same page..."
        ]
      }
    ],
    "map": []
  },
  "sources": {
    "https://example.com/page": {
      "title": "Page Title",
      "hostname": "example.com",
      "age": ["Monday, January 15, 2024", "2024-01-15", "380 days ago", "2024-01-15T13:45:02Z"]
    }
  }
}
Text to Vector
How does the LLM process the full list of snippets or document chunks? It does so by first embedding them. The simplest way to understand would be to imagine each text snippet getting converted to a multi-dimensional vector. A vector is just a list of numbers that represents the meaning of a piece of text. Each number in the list captures some dimension of meaning the model learned during training, things like topic, tone, or context, though no single number maps to something as clean as “this is about finance.”
Text with similar meaning ends up as points that sit close together in that space; unrelated text ends up far apart.
Let’s try to understand with a simple example:
Say each content chunk gets scored on two made-up dimensions:
- how fitness-related it is (-1 to 1 range)
- how tech-related it is (-1 to 1 range)
| Chunk | Fitness | Tech |
| “Best running shoes for beginners” | 0.82 | 0.18 |
| “How to train for your first marathon” | 0.68 | 0.06 |
| “Top laptops for gaming” | 0.08 | 0.90 |
A user’s query, “marathon training tips,” gets embedded the same way: roughly (0.75, 0.12).
On a graph it all looks like:
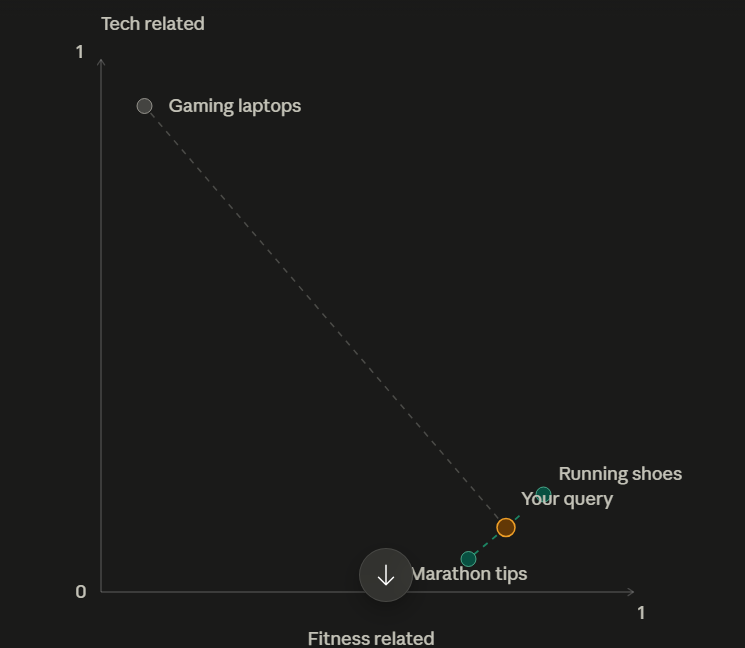
You don’t need to worry too much about the details – just notice how close the user’s query is to “How to train for your first marathon” and “Best running shoes for beginners”. Also notice how far away it is from “Top laptops for gaming”.
What we created above are simple 2 dimensional vectors which can be easily visualized by humans. We could add another dimension too (“How marathon related it is”) and still visualize it. You would also notice that in 3D each vector is more specific than before.
We can keep increasing dimensions and each increase would increase the specificity of the vectors. At one point the vector would be specific enough to uniquely represent the underlying text. Unfortunately, humans can’t visualize beyond 3D.
In production RAG today, the document embeddings are above 3000 dimensions! You can imagine how much information each such vector contains!
A 300 Dimensional Vector Sample
For the fun of it I wrote a short code using Python to convert text examples to 300 dimension vectors. Here’s how it looks like:
{

 "text": "How to use HubSpot for email sequencing",

 "model": "en_core_web_md",

 "dimensions": 300,

 "vector": [

   -0.7982485890388489,

   0.39568713307380676,

   -0.2642015814781189,

   -0.24310913681983948,

   -0.22365069389343262,

   -0.07218343019485474,

   0.03367086127400398,

   -0.1816299855709076,

   0.10009239614009857,

   1.2864570617675781,

   -0.06299541890621185,

   -0.03151585906744003,

   -0.10663744062185287,

…

]

}
I will use this again shortly to demonstrate the real power of RAG.
How Far Apart are the Vectors
In the earlier baby graph we noticed that even in 2D similar documents were clustering together. The query was positioning itself closer to the documents that were of similar context.
In 3000 dimensions too something similar happens.
In this 3000 dimensional space the vectors position themselves near or far from the others.
The user query is also embedded as a 3000 dimension vector and placed in the same space.
Can we calculate the distance between the vectors? There are a few ways such as Euclidean distance (straight line distance between 2 vectors) and Cosine Similarity (angle between 2 vectors).
In the case of RAG, cosine similarity is the method used.
To calculate Cosine similarity the dot product of 2 vectors is divided by the product of the magnitudes. Personally, my maths isn’t strong enough to explain such calculations. For the purpose at hand we just need to understand that the cosine similarity will give us a distance between 2 vectors in the range of -1 to 1.
Let’s say the distance between vector 1 & vector 2 is 0.10 and the distance between vector 1 & vector 3 is 0.15, we can interpret that vector 1 is closer to vector 2 than to vector 3. It would also imply that the document behind vector 1, is more similar to the vector 2 document than the vector 3 document.
The Shortest Distance
RAG works on the following principle: the document whose vector is closest (shortest distance by cosine similarity method) to the query vector contains the answer to the query!
There are some very typical reasons which may deny a win to your document snippets:
- Your document makes sense on the whole but the snippets independently don’t. Remember how chunking works: the retrieval system doesn’t see your full page, it sees a slice of it, often a few hundred tokens wide. If a snippet only makes sense with the paragraph before it for context (“as mentioned above,” “this approach,” “the second option”), the chunk that gets embedded is missing the meaning it depends on. Its vector ends up vague, sitting nowhere near the query it should have won.
- Your snippet isn’t focused enough, it might be talking about too many things instead of focusing on the answer. A chunk that covers three subtopics gets an embedding that’s an average of all three, close to none of them. A competitor’s chunk that says one thing clearly will out-position yours for a query about that one thing, even if your page covers the topic in more depth overall.
Losing this race is the difference between being cited in the answer and not existing as far as the user is concerned. There’s no page two in an AI-generated response.
Let me show you a live example to make it all memorable.
Do note, this example uses just 300 dimensions but it should be good enough to make the point.
Practical Example using 300 Dimensional Embedding
Let’s consider the following Prompt:
How to select an AI stock for long term investing Now consider 3 different snippets competing to be the answer
Snippet 1:
To select an AI stock for long-term investing, evaluate four things: revenue growth tied to genuine AI demand rather than AI branding, a defensible moat such as proprietary data, distribution, or switching costs, a path to profitable unit economics rather than growth funded by continuous cash burn, and a valuation that hasn't already priced in a decade of flawless execution. Favor companies with recurring revenue and expanding margins over ones riding a hype-driven narrative with no earnings to show for it.

Snippet 2:
AI stocks are an exciting area because artificial intelligence is transforming many industries. There's a lot to think about when investing for the long term. Investors should consider their goals, do their research, and keep in mind that markets can be unpredictable. Many different factors can influence how a stock performs over time, so it's worth staying informed and being thoughtful about decisions.


Snippet 3:

Cats purr through a neural oscillator in the brainstem that sends repeated signals to the muscles around the voice box. Those muscles twitch rapidly, causing the vocal cords to vibrate as air passes over them during both inhaling and exhaling. This is why a purr sounds continuous rather than broken into separate breaths, unlike most vocal sounds animals make.
As discussed above, the step 1 in the RAG process would be to embed everything (query & each of the snippets)
V0 = Embedded User Query Vector
V1 = Embedded Snippet 1 Vector
V2 = Embedded Snippet 2 Vector
V3 = Embedded Snippet 3 Vector
For the embedding purpose we will use a free model which allows 300 dimension vectors. There are quite a few good paid APIs available that allow 3000+ dimensions.
After running the embedding process we get the following:
V0

{
 "text": "How to select an AI stock for long term investing",
 "model": "en_core_web_md",
 "dimensions": 300,
 "vector": [
   -0.70284104347229,
   0.11614711582660675,
   -0.16255918145179749,
   -0.041355498135089874,
   0.02171381749212742,
   -0.058715593069791794,
…
]
}


V1

{
 "text": "To select an AI stock for long-term investing, evaluate four things: revenue growth tied to genuine AI demand rather than AI branding, a defensible moat such as proprietary data, distribution, or switching costs, a path to profitable unit economics rather than growth funded by continuous cash burn, and a valuation that hasn't already priced in a decade of flawless execution. Favor companies with recurring revenue and expanding margins over ones riding a hype-driven narrative with no earnings to show for it.",
 "model": "en_core_web_md",
 "dimensions": 300,
 "vector": [
   -0.7298896908760071,
   0.23189248144626617,
   -0.09879773110151291,
   -0.04856324940919876,
   -0.11665076017379761,
…
]
}


 V2


{
 "text": "AI stocks are an exciting area because artificial intelligence is transforming many industries. There's a lot to think about when investing for the long term. Investors should consider their goals, do their research, and keep in mind that markets can be unpredictable. Many different factors can influence how a stock performs over time, so it's worth staying informed and being thoughtful about decisions.",
 "model": "en_core_web_md",
 "dimensions": 300,
 "vector": [
   -0.700207531452179,
   0.19877150654792786,
   -0.28039565682411194,
   -0.046419937163591385,
…
]
}


V3

{
 "text": "Cats purr through a neural oscillator in the brainstem that sends repeated signals to the muscles around the voice box. Those muscles twitch rapidly, causing the vocal cords to vibrate as air passes over them during both inhaling and exhaling. This is why a purr sounds continuous rather than broken into separate breaths, unlike most vocal sounds animals make.",
 "model": "en_core_web_md",
 "dimensions": 300,
 "vector": [
   -0.69475257396698,
   0.18907201290130615,
   -0.29103076457977295,
   0.012755528092384338,
   -0.024362683296203613,
…
]
}
Once we have the vectors, we need to calculate the distance of V1,V2,V3 from V0:
| Vector | Cosine Distance from V0 | Euclidean Distance from V0 |
| V1 | 0.0698 | 1.4439 |
| V2 | 0.0739 | 1.4717 |
| V3 | 0.1761 | 2.2137 |
V1 is clearly the closest to V0. V2 is further away but not too far. V3 is extremely far away.
Snippet 1 would thus be used for generating the answer to the user query.
These distances clearly represent the contextual similarities between the underlying snippets:
Snippet 3 had nothing to do with the query and thus is rightfully faroff.
Snippets 1 & 2 are close to the query. In the case of snippet 1, the user’s question is accurately answered without beating around the bush. Snippet 2 on the other hand may look like an answer but it’s actually serving not much purpose.
Accurate to-the-point content is definitely rewarded by the RAG process! If at 300 Dimensions we can spot such nuances – imagine the accuracy that can be achieved at 3000+ Dimensions.
The code that I used for calculating the embeddings is as follows:
import json
import spacy

TEXT = "" # Add text here

nlp = spacy.load("en_core_web_md")
doc = nlp(TEXT)

# doc.vector = average of the word vectors for all tokens (the standard
# spaCy approach for a whole-sentence embedding)
vector = doc.vector

print(f"Text: {TEXT}")
print(f"Dimensions: {vector.shape[0]}")
print(f"First 10 values: {vector[:10]}")
print(f"Has vector data: {doc.has_vector}")
print(f"Out-of-vocabulary ratio: {doc.vector_norm == 0}")

# Per-token breakdown (useful for debugging OOV words like brand names)
print("\nPer-token vector norms (0.0 = word not in vocab, e.g. some brand names):")
for token in doc:
   print(f"  {token.text:15s} norm={token.vector_norm:.3f}")

with open("embedding_spacy.json", "w") as f:
   json.dump({
       "text": TEXT,
       "model": "en_core_web_md",
       "dimensions": int(vector.shape[0]),
       "vector": vector.tolist(),
   }, f)
print("\nFull vector saved to embedding_spacy.json")